
Why We See the Events We Do and Not Something Else
John L. Casti
When was the last time you bucked a trend? Really swam against the tide? Chances are, you never really have—at least, not for long. But don’t be down on yourself: it’s not your fault. You may not have as much free will as you think.
Most of us are pretty much aware of our tendency to go with the herd. We tag along with fashions: our hemlines rise and fall, our trouser legs widen and narrow, or we buy technology stocks when others are doing the same. We accept that, much of the time, we’re not being ‘individual’. What we’re not really aware of is why.
There are evolutionary arguments, of course: if you haven’t enough information on which to base a judgement, the next best thing is to assume that the herd knows where it’s going. But a mathematical analysis of our activities indicates that there may be something deeper going on. We seem to be fated to act in a way that mimics patterns found elsewhere in nature.
We already know that some actions of society appear to follow laws that often apply to otherwise completely unrelated phenomena in the Universe. The numbers behind the fractal shape of a snowflake can also describe our society’s financial activities, for instance. Financial data is one thing, but why should the maths that describes a seashell’s spiral also underlie our technological progress? Why can our shopping habits be described by the same rules that dictate how galaxies are spread through the cosmos? It’s as though we are somehow programmed by mathematics. Seashell, galaxy, snowflake or human, we’re all bound by the same order.
Mathematical laws are already used to describe human activity, of course. There are various tools such as Bayesian theorems, power laws, hidden Markov processes, and cellular automata, just for starters. All of these have been used in modelling financial markets, with varying degrees of success—and popularity. But now an old mathematical idea first dreamed up in the 1930s has come to the fore again and is proving itself more powerful than anyone ever thought possible. It has enabled people to make specific predictions about the financial markets, forecasts that are now unfolding with uncanny accuracy. The fact that this technique also has something to say about what it is to be human makes it all the more remarkable.
To begin at the beginning, you have to go back to California during the Great Depression. Ralph N. Elliott, a Los Angeles accountant, is in frail health and unable to find work. While recuperating, he has plenty of free time to investigate the stock market and try to work out why it has just lost 90 per cent of its value over a three-year period. He becomes convinced that there are repetitive patterns within market indices such as the Dow Jones index. Of course, Elliott knows it’s not really saying much to point out that the Dow Jones moves in cycles. What he needs to understand is how to characterise the kinds of cycles, and then to look far patterns within them. He realises that such an understanding would enable alert investors to predict the rising prices of a bull market, foresee the decline of a bear market and even anticipate great crashes such as those of October 1929.
Elliot, a hands-on specialist in corporate financial rescue, was no stranger to market analysis or the ebbs and flows of business and eventually managed to fit together the pieces of a fascinating puzzle. Elliott’s great leap forward was the realisation that the cycles don’t originate within the financial markets, but are a product of the humans that drive them. ‘Human emotions are rhythmical; they move in waves of a definite number and direction’, Elliott observed. ‘The phenomenon occurs in all human activities, be it business, politics, or the pursuit of pleasure.’ And so, by analysing stock market data, he picked out certain fundamental rhythms. Today they are known as Elliott waves.
Elliot Waves
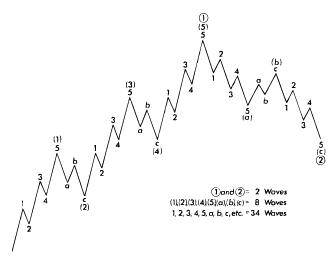
The theory of Elliott waves is based on patterns of ups and downs, underpinned by a few basic principles. First of all, action is always followed by reaction: up is eventually followed by down. At this level, an Elliott wave cycle is composed of two waves, where a ‘wave’ is simply a change—either an upward ‘impulse’ wave, or a downward ‘corrective’ wave. However, Elliott found that each wave isn’t necessarily just a straight line. Instead, it can be subdivided into five smaller waves, so an impulse wave might actually consist of up–down–up–down–up. Likewise, the data revealed that waves were sometimes subdivided into just three waves: down–up–down for a corrective wave, for example. So, on closer inspection, an up–down Elliott wave cycle is actually composed of eight waves. One slight complication is that the number of sub-waves within a given wave actually depends on whether that wave is with the overall trend or against it. So if the overall trend is downward, for example, then corrective waves in that trend have five sub-waves, and impulse waves have three (see Diagram).
You can now buy software that will take any series of data, such as stock exchange figures or CD sales, and use pattern-recognition techniques to pick out the various Elliott patterns at different timescales.
Spotting Elliott waves within the data is not an entirely mechanical procedure, but there are some rules of thumb that help. Here are just a few of the characteristics of a 5-wave rise:
- Wave 2 does not fall below the starting level of wave 1
- Wave 3 is not the shortest wave
- Wave 4 does not overlap the range of wave 1
- One impulse wave is usually extended, and it is generally wave 3
- Waves 1 and 5 tend to be of equal length
Wave sizes are often related by ‘Fibonacci ratios’. The ratio of two successive numbers in the Fibonacci sequence moves towards the limiting value 0.6180345 as we go further into the sequence, for example: that value is the inverse of what is often termed the ‘golden ratio’. Wave 2 generally retraces 0.618 of wave one, while wave four retraces 0.236 of wave three, a number derived from the ratios of the sequence’s first two terms.
However, just as ‘zooming in’ on an up–down pattern reveals eight smaller waves, zooming out shows that it can also be considered as a 2-wave component of a larger 8-wave cycle. So the wave principle is hierarchical in the sense that the same basic shape appears at all scales: each wave has component waves and is itself a component of a larger wave. This self-similarity at different scales is the hallmark of fractal patterns, which are seen all over the place in nature in things like fern fronds, coastlines, and blood vessels.
So how many scales, or ‘degrees’, of waves, sub-waves, and sub-sub-waves are there—how far can you zoom in or out? Elliott named nine degrees, from those lasting centuries to those lasting just hours. But the actual number of degrees may be limitless, since the same patterns show up even on one-minute graphs of stock prices, and are likewise presumed to operate over indefinitely large timescales.
Predicting Trends
As you might expect, the area in which Elliott waves have been most extensively applied is in finance. For instance, the value of the Dow Jones between 1932 and the present can be broken down in terms of Elliott waves. If you can identify the waves and sub-waves and if you know where you are on a wave, you know exactly where you’re going next. For example, Elliott used his wave theory to announce, in the middle of the worst of World War II, that a multi-decade stock market rise was about to begin. And financial guru Robert Prechter did the same during the midst of recession in September 1982 by announcing that a ‘super bull market’ had begun and forecasting a fivefold increase in stock values. In both cases, the Elliott waves enabled them to get it right.
But Elliott waves are something more profound than just a money-making tool. They have a very close connection with the series of numbers known as the Fibonacci sequence, where each number is the sum of the two previous ones. This produces an infinite series of numbers: 1, 1, 2, 3, 5, 8, 13, 21…
The number of waves that comprise the Elliott patterns at each successive level of detail are precisely the numbers of the Fibonacci sequence. It’s easy to see why when you consider how the pattern builds up. The simplest expression of a corrective wave is a downward straight line, while that of an impulse wave is a straight line upwards. So a complete up–down cycle is just two waves. At the next level the corresponding number of corrective and impulse waves are 3 and 5, respectively: Elliott’s theory says the downward line has 3 sub-waves, and the upward one has 5. The total cycle then consists of 8 waves, and we have the first six numbers of the Fibonacci sequence (see Diagram). This process continues indefinitely.
The connection between Elliott waves and the Fibonacci sequence is intriguing, because it links the wave principle that underlies the stock market with other natural patterns and processes found in living forms. The Fibonacci sequence appears all over the scientific landscape: it describes the spiral patterns found in seashells and the DNA helix, as well as the number of spirals on pine cones and sunflower seed heads, to give just a few natural examples. It also crops up in fractals.
So, according to Prechter, who produces a monthly publication called The Elliott Wave Theorist, these patterns reveal a direct connection between nature’s numbers and all of human behaviour. Prechter believes the wave patterns are an organising principle for myriad social behaviours, ranging from newspaper sales figures to the fortunes of national leaders.
The reason Elliott waves can tell us all this is simply because they are a direct reflection of human psychology—the rhythms of human emotion, as Elliott put it. It doesn’t matter what the exact mechanism is; the point is that they’re a result of human behaviour. Their success at predicting stock movements stems directly from the fact that price movements in financial markets mirror the collective beliefs of investors about the future. If the majority are optimistic, prices rise; if not, they fall.
But the stock market is just one way to take society’s emotional temperature. If you look at the average length of hemline as fashions change and plot it against the Dow Jones, there is a striking correlation: the stock market faithfully rises and falls with hemline length. The obvious explanation is that when people are feeling bold and adventurous, they buy stocks and wear more revealing clothes. When they feel threatened and conservative, they do the reverse. The mood is pervasive, and almost everyone gets swept along with it.
Prechter’s theory, which he calls socionomics, is that the units in a social system, whether they are investors, voters, music fans or shoppers, tend to base their decisions on what they see others doing. In other words, they herd. These decisions are then translated into a social mood, which shows up in indicators such as the Dow Jones, hemlines, lyrics in songs, and so on. Armed with Elliott waves, you can start forecasting all sorts of things. Indeed, Prechter has had astonishing successes with the method in areas where no one else is even trying.
Take Major League Baseball, for example. In 1991, the sport enjoyed what some commentators felt was its most exciting season ever. Fans got so enthusiastic that a record 760,000 of them turned out to welcome the two teams returning to Atlanta and Minneapolis from the World Series, despite the fact that it was sleeting in Minneapolis. Players, owners, and leagues predicted ever-increasing popularity for the sport, and cities began building new stadiums.
But socionomics predicted exactly the opposite. Prechter plotted the 90-year annual ticket sales for Major League Baseball and identified an unmistakable Elliott wave. Immediately following the 1992 season, he wrote: ‘If you’re an investor, take profits on baseball cards. If you’re a player, sign a long-term contract. If you’re an owner, sell your club.’ In the ensuing months, the speculative bubble in baseball-card prices burst, the stock price of card maker Topps collapsed, a players’ strike cancelled the 1994 World Series and the TV ratings for the World Series began a steady fall to an all-time low. And he says the retrenchment is not over yet.
Prechter has also used these principles to anticipate the peak and subsequent fall in the popularity of a financial guru—himself. Using the number of subscribers to The Elliott Wave Theorist as a measure of popularity, he saw that the subscription levels obeyed an Elliott wave pattern of their own. As wave 5 of his overall upward surge began to slow in late 1987, he knew that the end of his ride as a guru was near. And sure enough, despite the fact that 1988 was one of his best forecasting years ever, various members of the media had had enough of Prechter and began to attack the persona that they and their colleagues had overpromoted. He’s now written about far less, and far less lionised.
Setting the Mood
Socionomics completely turns on its head the idea that events shape social mood. Since trends in social mood produce Elliott-wave patterns, the mood itself must follow a definite pattern. And if that’s true, it certainly cannot be the result of external events, which are random and don’t follow set trends. The only possible conclusion, Prechter argues, is that the direction of causation goes the other way: social mood actually shapes events.
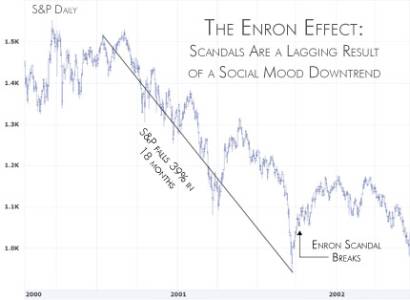
The Enron scandal in the US illustrates that socionomic viewpoint very well. For weeks, newspapers and magazines trumpeted the conventional direction of cause and effect: the scandal deeply unsettled investors, they said, triggering the collapse. But socionomic thinkers argue just the opposite: worried investors precipitated the scandalous behaviour (see graphic).
Who Collapsed Enron?
The accounting scandal that emerged within Enron could not have been what discouraged investors and collapsed the company. The stock market was declining in the period before the malpractice came to light, and most investors knew nothing about the shady dealing prior to or anytime during the stock market’s fall. And while the scandal unfolded, primarily from November to March, the market actually grew again. It’s clear that even as the Enron drama developed, investor and consumer psychology actually improved and stock prices rose.
So what really happened? From the socionomic point of view, it was the investors who precipitated the Enron scandal, not the other way round. Stock prices had been falling for a full 18 months prior to the event. Enron stock also retreated, undermining investor support. By the time the controversy came to light, the trend toward an increasingly negative mood was already over. In fact, by late September of last year, it was time for the market to make its largest move upward in over a year-and-a-half.
The psychological climate of this bull market encouraged companies to mislead investors. The mass psychology of the stock mania prompted investors to accept all manner of corporate falsehoods that reflected and reinforced their ebullient mood. So it wasn’t misdoings that killed the stock prices, it was simply that crashing stock prices eventually drew attention to the corporate misdeeds. That’s socionomic thinking for you.
The conclusion of Elliott wave theory is that the herding instinct in society governs events in economics, politics, and even war and peace—and all these events follow exactly the same kinds of cycle. This idea has deep implications. If Elliott waves can describe all of human activity—economic trends, wars, shopping habits and political ideas—and yet a sequence of numbers that is ubiquitous in nature can describe Elliott waves, is our behaviour somehow dictated by those numbers? Is what we do just a natural process, like the way a snowflake or a seashell forms?
Conspiracy theorists and fans of science fiction would love to take it as indication that we’re helping to carry out some cosmic computation. But, whatever the real answer, we may well not like it. Somehow, for all our cleverness and cherished free will, it seems we might simply be living by numbers.